
October 16, 2023
2
min. read
Steps and Processes in Supply Chain Analytics
After discussing the challenges and opportunities of different types of Data Analytics in the previous blog post, it is time to dive deeper into how exactly data can answer even the most mundane logistics questions. As a matter of fact, to arrive at a conclusion one thing cannot be missing: a process.
These are the required steps of the process that allows data analysts to reach an answer starting from raw data.
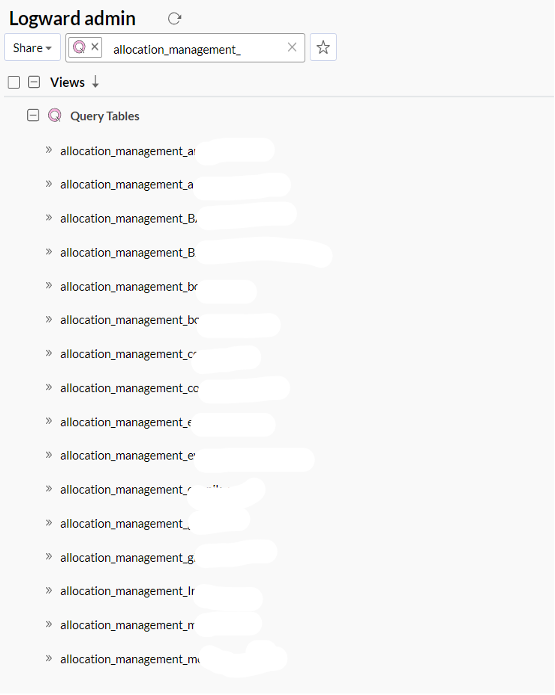
1. Data Cleaning and Preparation
Supply Chain data is of a vast variety. Not only there are, for example, different aliases or references of the same booking (Freight Forwarder Reference, Customer Reference, Booking Reference, Carrier Reference and so on…), but there are also different terminologies used by various types of customers for the same designated processes or events. Plus, customers’ operations may or may not be following the same processes either. Hence, the challenge to understand and interpret, to transform raw data into useable data sets, and to standardize it, takes some effort. At Logward, all this is done using scripts that Logward’s team develops after comprehending the customers’ data. Scripts are used to bring data from various customers, into a standard form, so that it can be streamlined for the next steps.
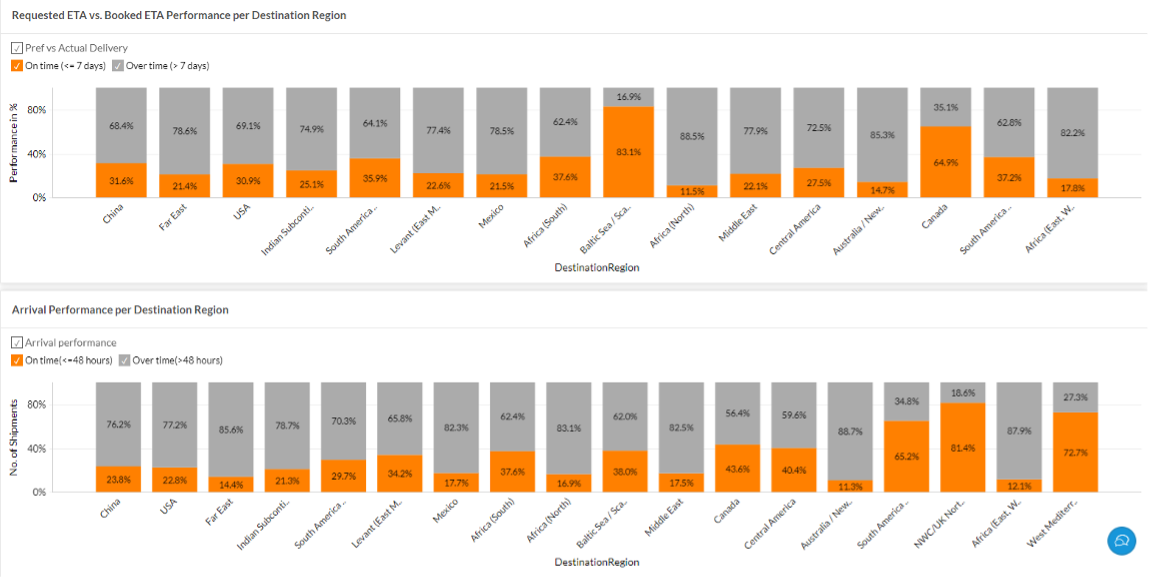
2. KPI Computation (Measures and Calculations)
Despite each customer being unique, the supply chain industry still works on certain established methods. A combination of both these ideologies helps figure out and create KPIs that not only provide an overview of the supply chain as per industry standards but also specific insights that are derived based on customers’ demands. More specifically, Logward’s Customer Success Team liaises with Analysts to produce relevant KPIs that help steer business for good. For example, if customers are shipping medicines or food, then a shipment delayed by six hours can be tagged as “delayed”. However, if they are shipping construction materials, then a 48-hour delay is acceptable, and the shipment can be categorized as “on-time”.
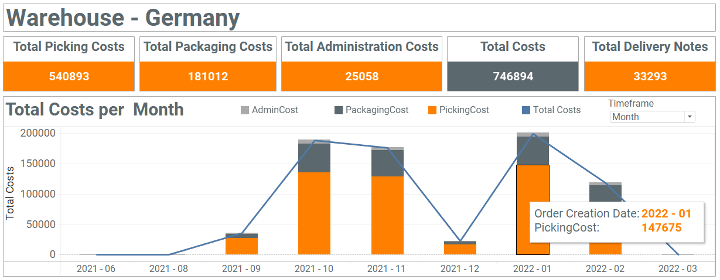
3. Combining Insights with the Use of Categorical Fields
Taking“Cost” as an example, it is a “Measure” when categorized as a type of datapoint/set. Similarly, when figuring out the value of this measure for various aspects of the customer business, the measure is combined with a categorical value to get the subset of the total value of the measure. In warehouse management, for example, there are administration costs, picking costs, packaging costs, transport costs and so on. All these measures are a subset of the actual “Cost” measure broken down by a categorical field, such as “Type”. Such analysis is also a much-needed aspect of reporting KPIs to customers when it comes to giving them an overview of their own operations.
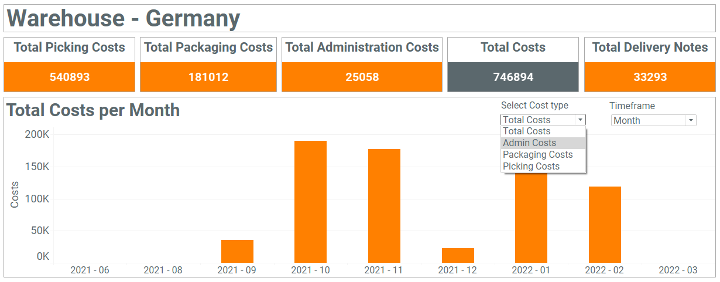
4. Finding suitable Visualizations
Sticking to the example of costs, and assuming that Logward is helping customers track their warehouse costs over the period of the last year, and that there are various cost categories involved in managing a warehouse, is it fair to show a simple pie chart with a percentage share break-up of all costs for the last year? It is, for instance, more interesting to see how transport costs have evolved over the years, but how do we get that from a pie chart?
Assuming it is possible to provide a trend of each of the cost categories over the last year, there can be different trend lines for each category on a single graph. This can be confusing – twelve months' worth of data shown with a different coloured curved line for each category in one visualization.
Here lies the challenge of figuring out and choosing suitable visualizations that aid the KPI as well. In the given example a pie chart is not the best solution, but it certainly is for looking at measures such as distribution of On-Time Shipments vs. Delayed Shipments at the POD.
Here are some options:
5. Storytelling
All efforts culminate into helping Logward analysts produce dashboards and reports that not only provide a picture of what has happened but also what is potentially about to happen. This coupled with prior awareness of the sequence of events scheduled as per customers’ operational processes, helps prepare reports that are telling a story rather than being just a dump of statistics and random numbers. This storytelling has an impact because customers’ data when shared via dashboards is easier to grasp. The strength of storytelling through dashboards lies in making information easier to grasp and, in this way, improving decision-making.
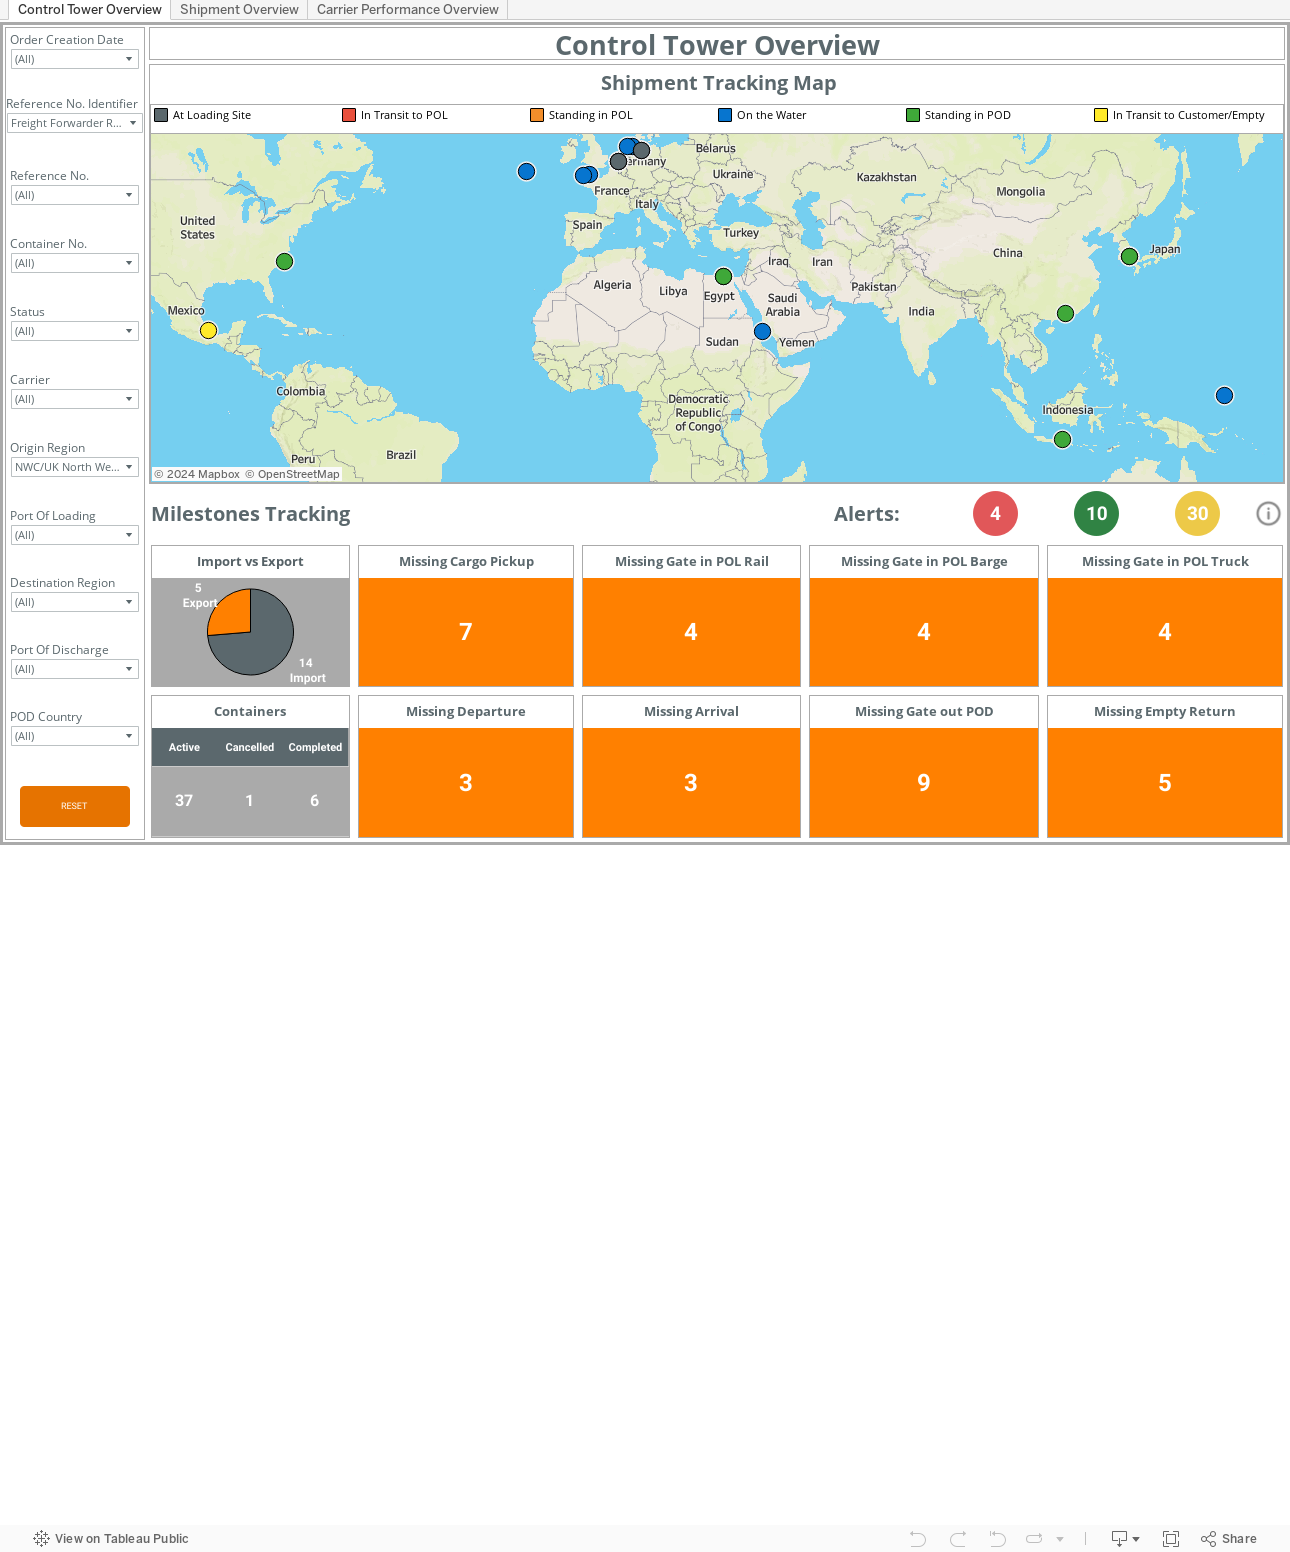
Click here to open the dashboard: https://tabsoft.co/3emqZGp
Conclusion
Big amounts of data will never bring any value if processes are not put in place to clean and combine data and communicate insights. Furthermore, in logistics, domain knowledge needs to be included at every step to provide end-users with the most relevant information.